Munin is a networked resource monitoring tool that can be used to monitor all computers on your network. It displays the gathered information from your system as graphs through a web based interface. With the help of Munin, you can monitor the performance of your computers, services, networks, SANs, applications, weather measurements etc.
How it works?
Munin uses RRDTool and a frame work written in perl. Munin has a master-node architecture in which the master connects to all the nodes at regular intervals and asks them for data. It then stores the data in RRD files, and updates the graphs.
Install Munin On CentOS 6.5
While this tutorial is applicable for CentOS 6.5 32 bit Edition, it should serve you well on other RPM based distributions too.
Munin will not be found in base repositories, hence we add EPEL repository to install Munin. Refer the following link to Add EPEL Repository in your CentOS 6.x systems.
Fedora users need not to install EPEL, Munin is found in the default repositories of Fedora.
Since Munin is a web based Monitoring tool, your CentOS server should have a working LAMP stack. To install LAMP server on CentOS 6.x, follow the below link.
Now let us install Munin with command:
# yum install munin munin-node -y
After installing munin, a folder named munin will be created automatically under your apache root document.
Configuration
Edit file /etc/httpd/conf.d/munin.conf,
# vi /etc/munin/munin.conf
Add/Edit as shown below.
[...]
#Uncomment the following lines
dbdir   /var/lib/munin
htmldir /var/www/html/munin
logdir /var/log/munin
rundir  /var/run/munin

[...]

# a simple host tree. Set your system name
[server.unixmen.local]
address 127.0.0.1
use_node_name yes

[...]
Save and close the file.
Set ownership to munin directory in the apache root document folder with following command.
# chown -R munin:munin /var/www/html/munin/
Edit file /etc/httpd/conf.d/munin.conf,
# vi /etc/httpd/conf.d/munin.conf
Add the following lines at the end.
<Directory /var/www/html/munin/>
Order Deny,Allow
Deny from all
Allow from 127.0.0.1 192.168.1.0/24
</Directory>
Here i allowed the clients who has IP address in 192.168.1.0/24 series to view the Munin graphs. If you want to allow all clients to access Munin graphs, change the line Allow from 127.0.0.1 192.168.1.0/24 toAllow from All.
Setup user to Munin
Now we have to setup the munin administrative account. Please note that munin administrative account name is “Munin”. It will be found in the /etc/httpd/conf.d/munin.conf file at the top.
[...]

AuthName "Munin"

[...]
You can change admin account name as per your liking. Now enter the following command to setup the password for the user “Munin”.
# htpasswd -c /etc/munin/munin-htpasswd Munin
New password:
Re-type new password:
Adding password for user Munin
You don’t have to use -c parameter if you want to add additional users.
Now start/restart apache and munin services with following commands.
# service httpd restart
# service munin-node start
# chkconfig munin-node on
Note: Wait for a couple of minutes or reboot your system to allow munin to create necessary files/folders automatically on your apache root folder.
Access Munin
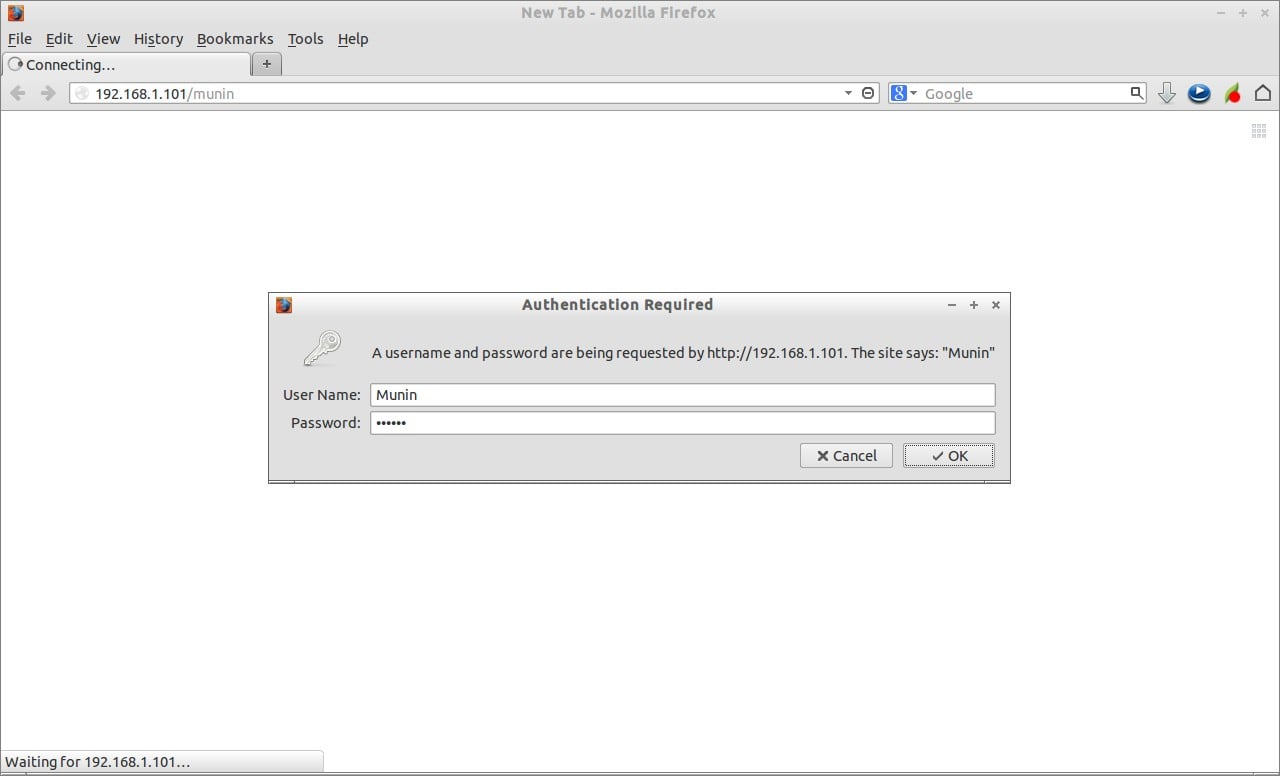
Now you can access the munin web interface from your browser with URL http://domain-name/munin orhttp://ip-address/munin.
Enter the username and its password which we created earlier. In my case its Munin and centos.
 This is how my Munin dashboard looks.
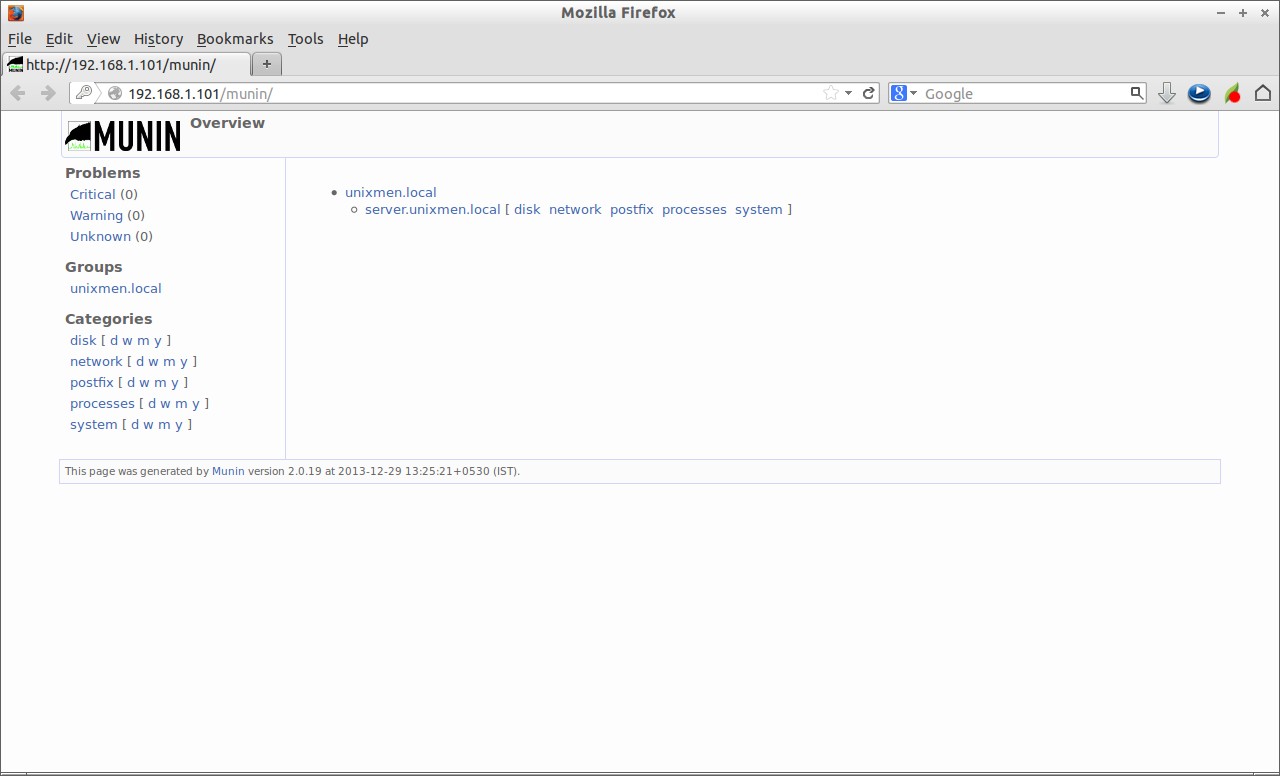 Click on the hostname, you’ll see now the server status as graphs.
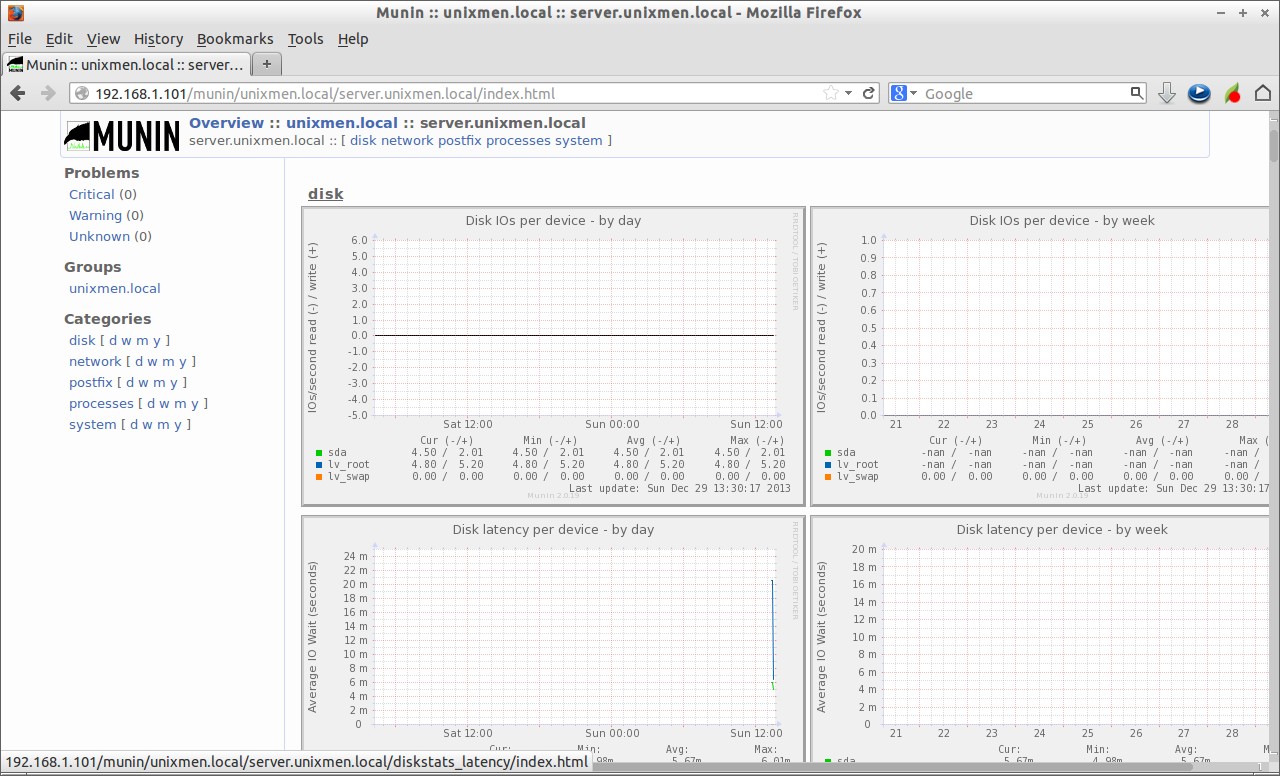 By default, there are five categories(plugins) on the left to make easy to understand and monitor system status.
– Disk
– Network
– Postfix
– processes
– System
Disk Monitoring:
 Network:
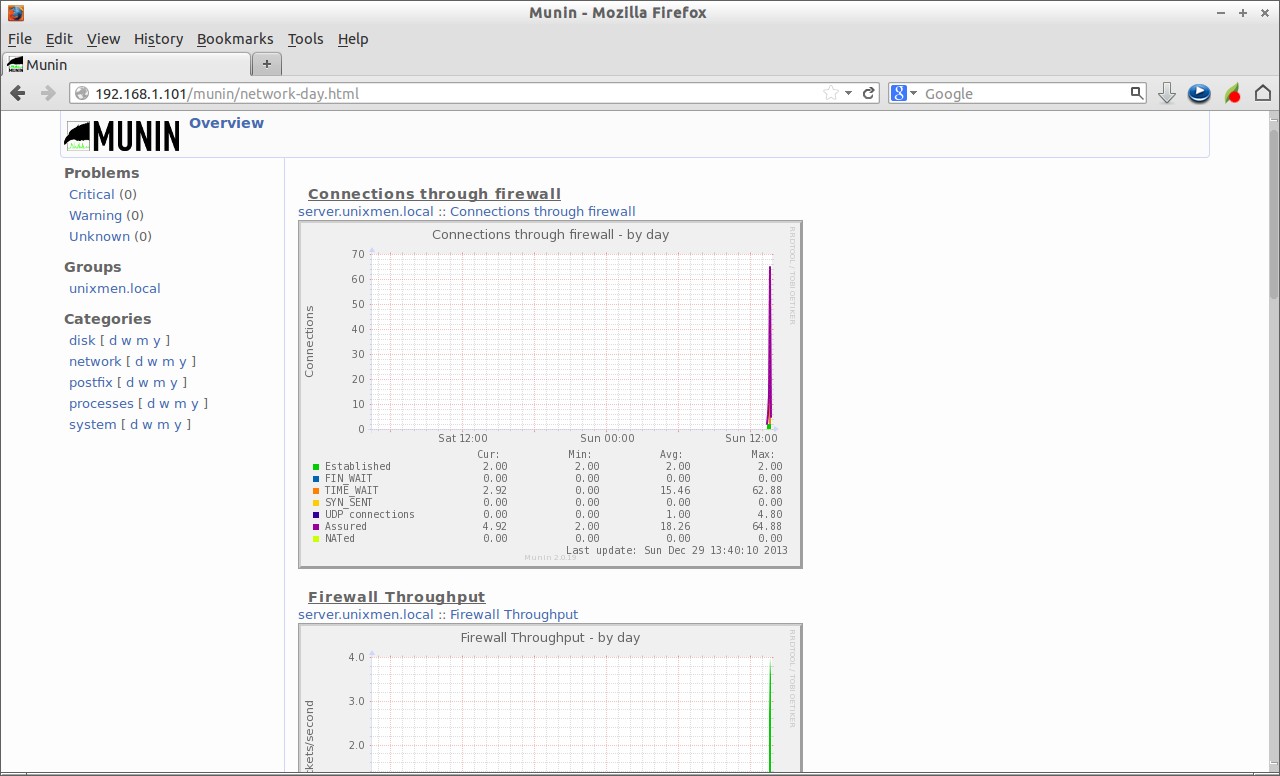 Postfix:
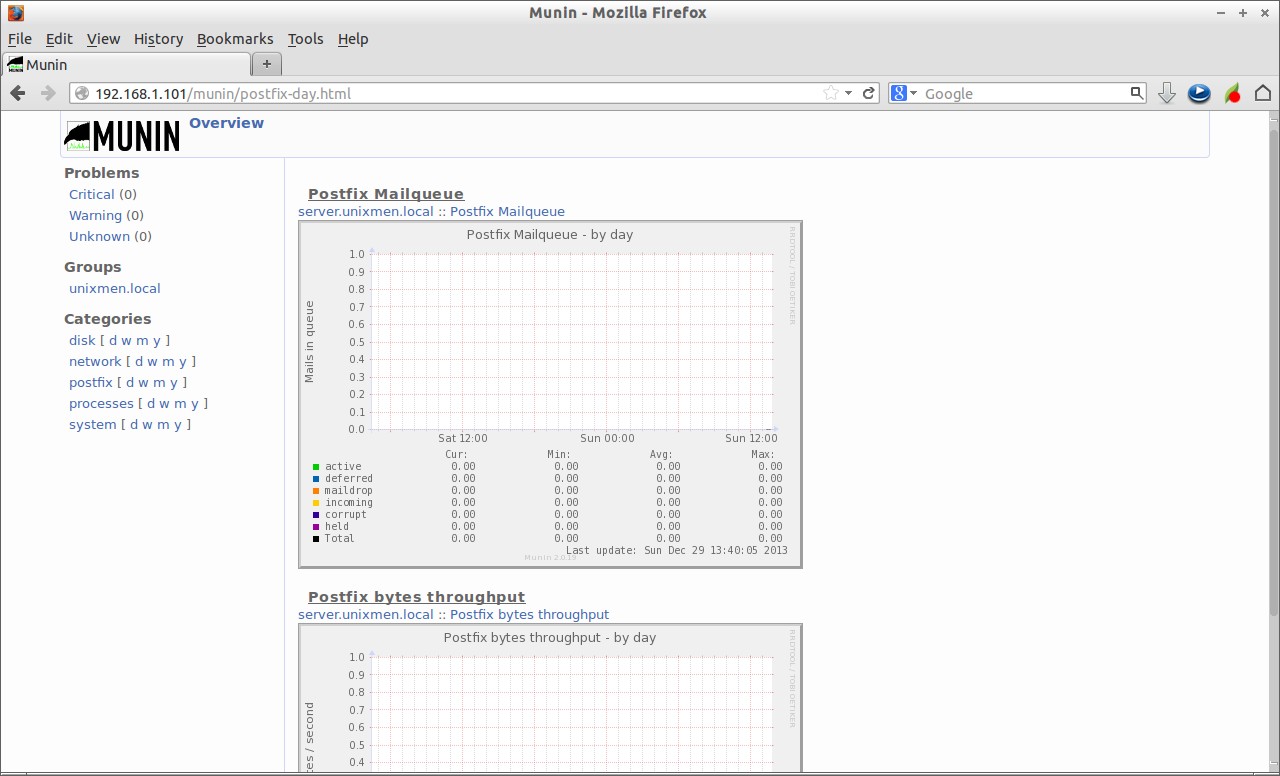 Processes:
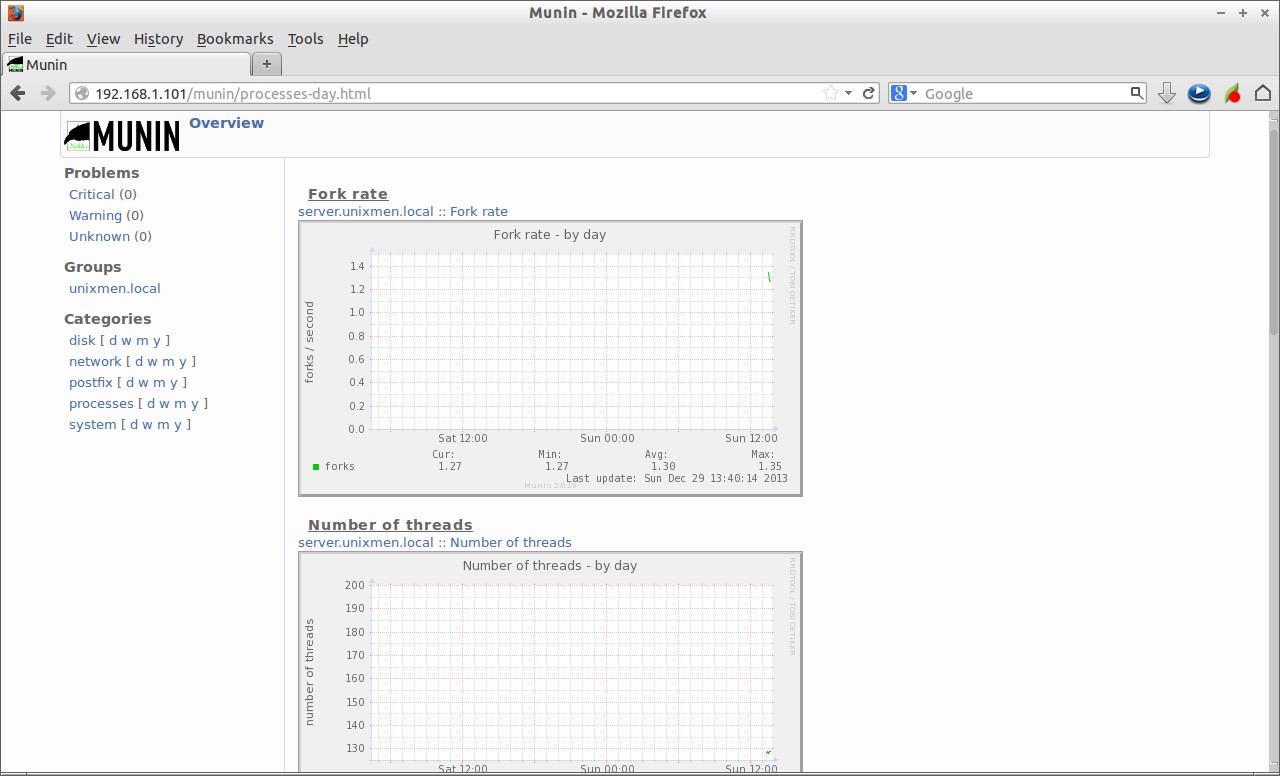 System:
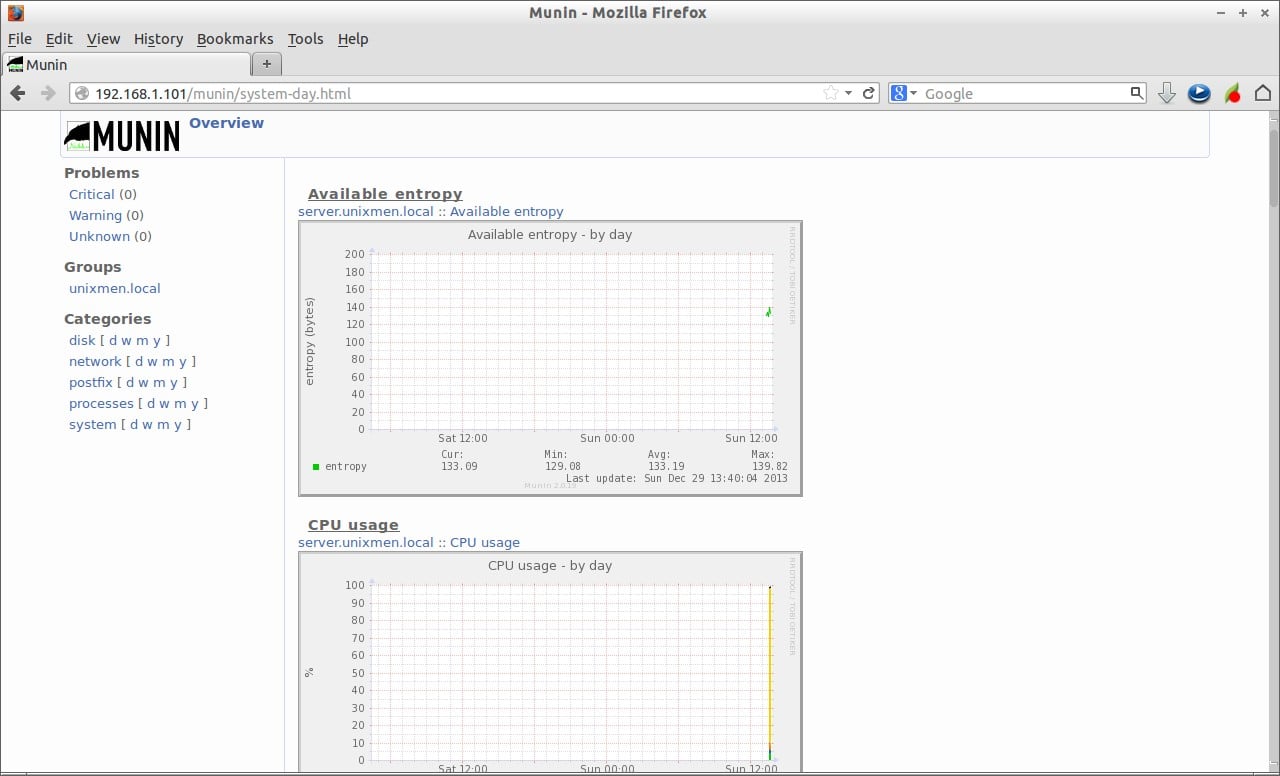 Add Monitoring Client
We can monitor remote hosts too. Go to your client systems and install munin-node package.
# yum install munin-node -y
Configuration
Edit file /etc/munin/munin-node.conf,
# vi /etc/munin/munin-node.conf
Set client hostname and specify Munin server IP address.
[...]
host_name sk

[...]

allow ^192\.168\.1\.101$
allow ^::1$

[...]
Save and close file. Here sk is my client hostname. 192.168.1.101 is my Munin server IP address.
Start munin-node service on your client system.
# service munin-node start
# chkconfig munin-node on
Then go to your Munin server and add the client system host name and ip address in/etc/munin/munin.conf file at the end.
# vi /etc/munin/munin.conf
Add the following lines.
[sk]
address 192.168.1.100
use_node_name yes
Save and close. Restart the munin service. Wait for couple of minutes(approximately 5 minutes) or reboot the Munin server to allow munin to create necessary files/folders for your monitoring target.
 As you see in the above screen shot, My client desktop has been added to Munin server.
Enable more Munin plugins
By default, there are only few monitoring items(plugins) will be shown in Munin interface. But there are many and we can add them if we need. Those items will be found under the directory/usr/share/munin/plugins/.
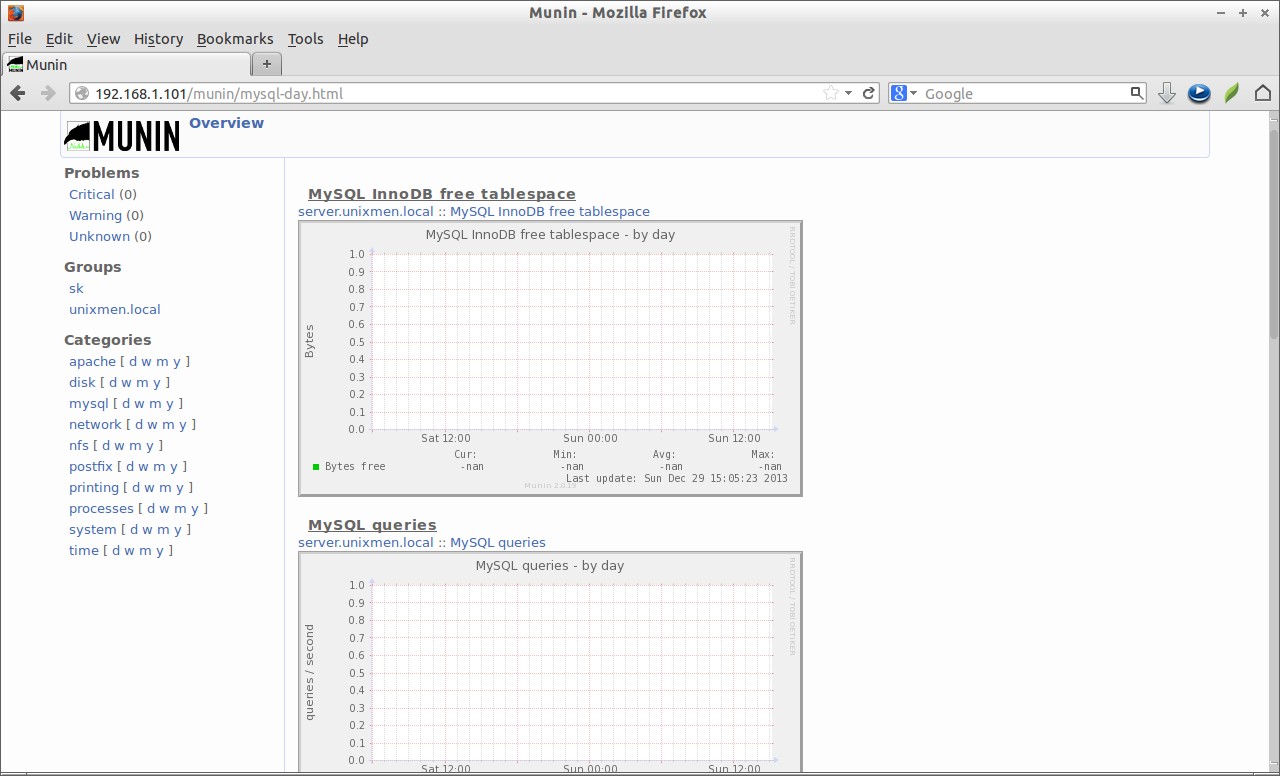
For example, here we will add mysql plugins. To do that, create a sym link to the plugins as shown below.
# ln -s /usr/share/munin/plugins/mysql_* /etc/munin/plugins/
Restart munin-node service on your server.
# service munin-node restart
Wait for 5 minutes and you’ll see that the mysql items will be added as shown below.
 That’s it. We reached the end of this tutorial. Most of you will probably figure out how to install and configure Munin server/clients and also how to monitor the various services using Munin. But while it’s fairly simple, it’s not trivial. Any how If you need additional details, refer the link given below.
Fuente:
http://www.unixmen.com/install-munin-monitoring-tool-centos-rhel-scientific-linux-6-56-46-3/